
When to start a DFMEA?
The timing of a DFMEA is important but often difficult to get right. Start it too late in the design process and carry out the DFMEA retrospectively the chances are that any risks identified will be too late to resolve. This becomes a paperwork-tick-box-ticking exercise as well so ‘buy-in’ from the DFMEA team may be questionable as well as the motivation to do it properly. The best result from a DFMEA being carried out after the event will result in implementing controls dependent on design detection controls only rather than any opportunity to implement preventative controls.
A DFMEA should be seen as a tool to support the design process from the start where the designer/lead engineer uses a multi-disciplinary team to help identify risks as the design evolves. The DFMEA should be started as early on in the design process as is practicable. However, the team has to be mindful about planning in the DFMEA sessions and take into account the fluidity of the design (especially if there is significant styling and design input from the customer) otherwise there will be a lot of effort spent on assessing risks for interfaces that will change on a day by day basis. There is no real definitive guidance on this, only to manage the DFMEA around the context of the project and start as early as possible. It is important to build in the DFMEA sessions as part of the project planning phase.
Preparation
As we shall see in Step 1 always start with an interface list and list of components. This is easier to adjust as the design evolves. However, for a design that is likely to be subject to changes on a daily basis, start the DFMEA at the concept stage but focus on the top level SYSTEM requirements and key interfaces. What is the design trying to achieve and how is this going to interface with the SYSTEM? i.e. as manufacturer is likely to be developing SUB-SYSTEM levels products how is this going to impact on the SYSTEM (i.e. the whole vehicle)? Try to keep the DFMEA focussed on the high level functioning of the sub-system to start with and avoid drilling down into the detailed interfaces too early on.
As the design progresses and the various elements start to become increasingly understood and established as the most likely solution then start to focus on the key interfaces and then continue to work through the interface list remembering to include all the components.
What is important is to attempt to complete the bulk of the DFMEA (i.e. all the key interfaces) before the design is fixed.
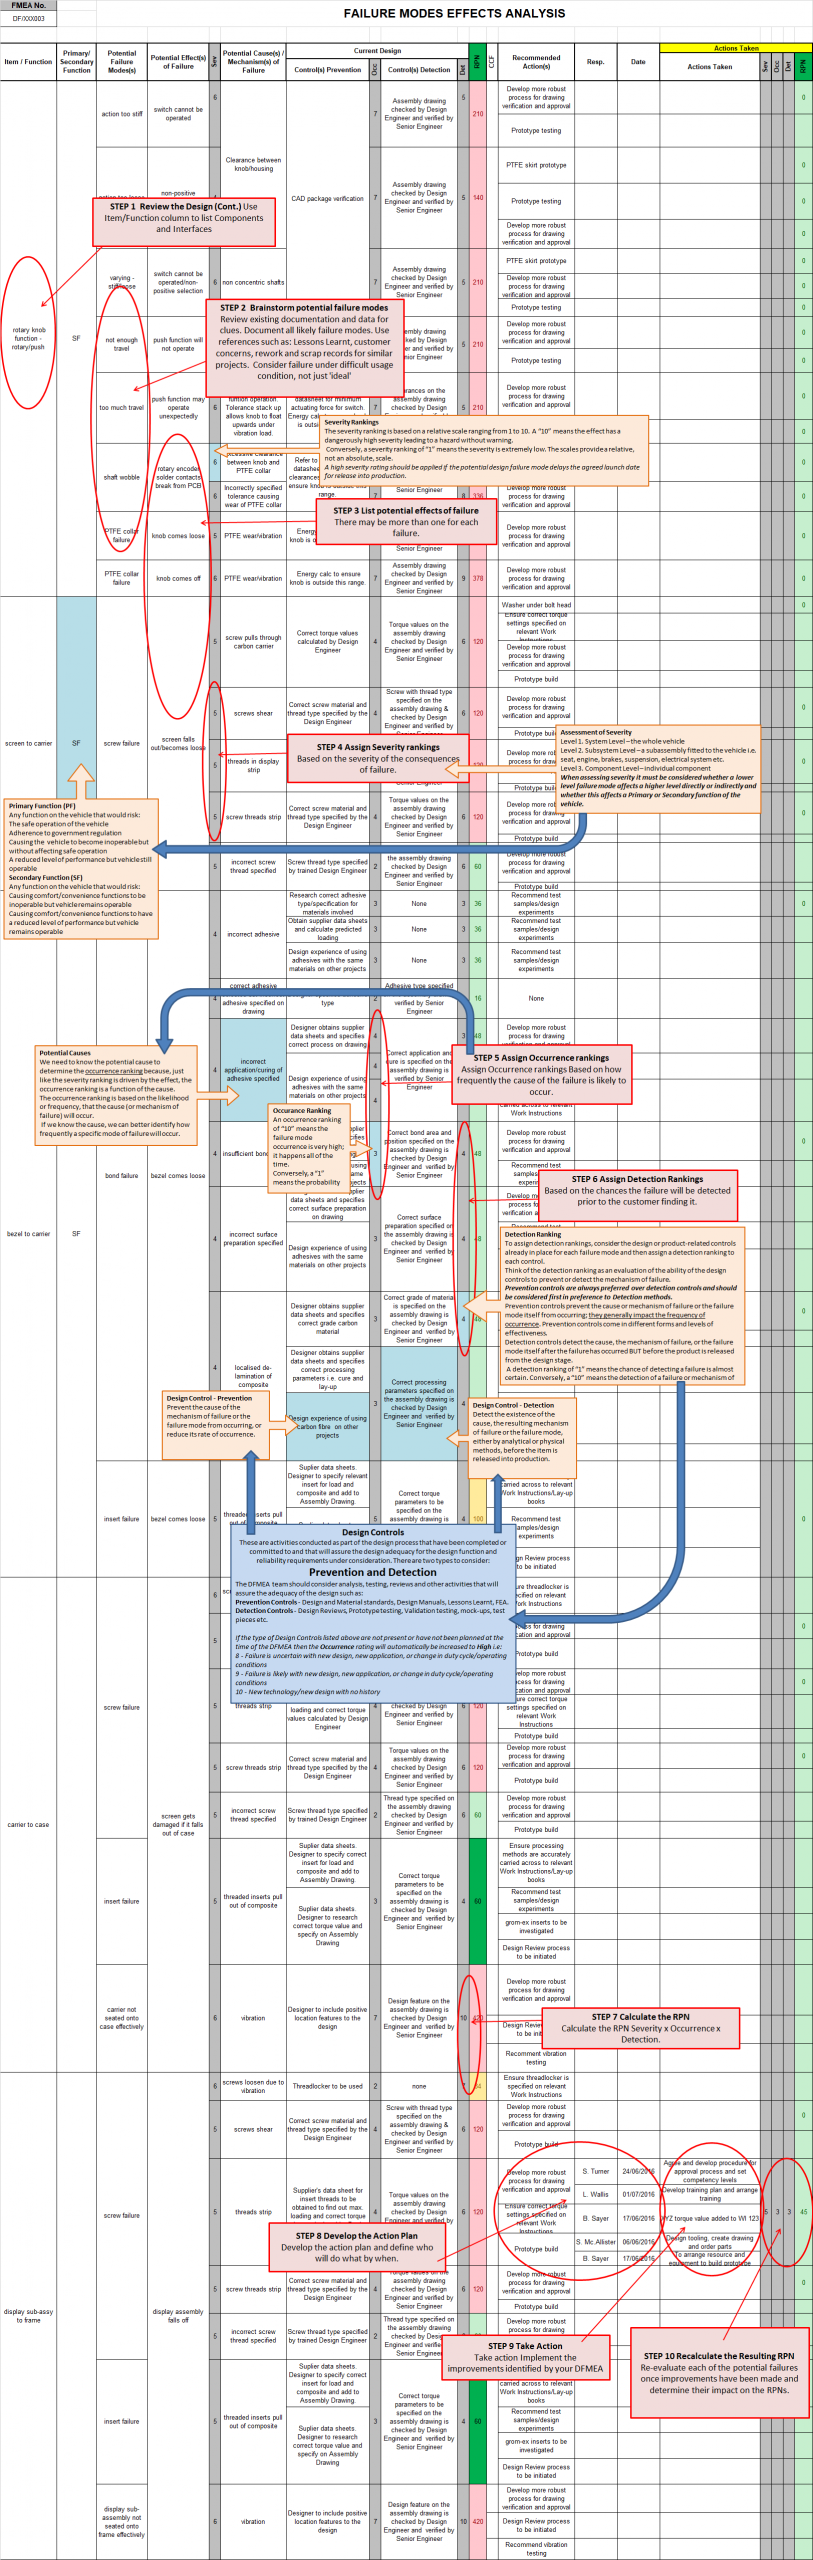
Step 1: Review the Design
To make the first DFMEA for a new product effective as possible, and to save time, it is important to thoroughly prepare beforehand. Gather together CAD models, drawings, design briefs, customer requirements documents, lessons learnt and examples of similar designs or features.
Re-familiarise yourself with this procedure before planning to start a DFMEA. Understand the System, Subsystems and Components being analysed and define their functional requirements and characteristics. Understand the design and the customer’s requirements. Use a CAD concepts or schematics of the design/product to identify each component and interface and create a list.
Ensure you understand the customer’s requirements. Consider:
- How it is to be used
- Where it is to be used on the vehicle
- What country it is to be used in
- Envelop
- The top level system
- Environmental
- Who is to use it
- Interfaces with other sub-systems
- Help assure all team members are familiar with the product and its design.
- Identify each of the main components of the design and determine the function or functions of those components and interfaces between them.
- Work through the design and list all components and interfaces.
- Add Reference Numbers to each component and interface.
- Document the function(s) of each component and interface.
Note: Remember interfaces also include interfaces with the product the part is going to be used with/fitted to, plus interfaces with other sub-assemblies, inter-connects and software.
Are there functions and features of the product that affect other components or systems?
- Make sure you are studying all components defined in the scope of the DFMEA.
- Use a CAD model, print or schematic for the review.
- Review a prototype, sample or previous similar design.
- Invite a subject matter expert to answer questions.
- Are there inputs provided by other components or systems that are needed to perform intended functions of the product?
Step 2: Brainstorm Potential Failure Modes
Consider potential failure modes for each component and interface.
- A potential failure mode represents any manner in which the product component could fail to perform its intended function or functions.
- Remember that many components will have more than one failure mode. Document each one. Do not leave out a potential failure mode because it rarely happens. Don’t take shortcuts here; this is the time to be thorough.
Prepare for the brainstorming activity.
- Before you begin the brainstorming session, review documentation for clues about potential failure modes.
- Use customer complaints, warranty reports, and reports that identify things that have gone wrong, such as hold tag reports, scrap, damage, and rework, as inputs for the brainstorming activity.
Use Lessons Learnt from similar designs or designs with similar features - Additionally, consider what may happen to the product under difficult usage conditions and how the product might fail when it interacts with other products.
Step 3: List Potential Effects of Failure
The effect is related directly to the ability of that specific component to perform its intended function.
- An effect is the impact a failure could make should it occur.
- Some failures will have an effect on customers; others on the environment, the process the product will be made on, and even the product itself.
The effect should be stated in terms meaningful to product performance. If the effects are defined in general terms, it will be difficult to identify (and reduce) true potential risks.
Step 4: Assign Severity Rankings
The ranking scales are mission critical for the success of a DFMEA because they establish the basis for determining risk of one failure mode and effect relative to another.
The same ranking scales for DFMEAs should be used consistently throughout an organization. This will make it possible to compare the RPNs from different FMEAs to one another.
- The severity ranking is based on a relative scale ranging from 1 to 10. A “10” means the effect has a dangerously high severity leading to a hazard without warning.
- Conversely, a severity ranking of “1” means the severity is extremely low. The scales provide a relative, not an absolute, scale.
The best way to customize a ranking scale is to start with a standard generic scale and then modify it to be more meaningful to your organization.
- By adding organization-specific examples to the ranking definitions, DFMEA teams will have an easier time using the scales. The use of examples saves teams time and improves the consistency of rankings from team to team.
- As you add examples specific to your organization, consider adding several columns with each column focused on a topic. One topic could provide descriptions of severity levels for customer satisfaction failures and another for environmental, health, and safety issues. However, remember that each row should reflect the same relative impact, or severity, on the organization or customer.
Step 5: Assign Occurrence Rankings
We need to know the potential cause to determine the occurrence ranking because, just like the severity ranking is driven by the effect, the occurrence ranking is a function of the cause.
- The occurrence ranking is based on the likelihood or frequency, that the cause (or mechanism of failure) will occur.
- If we know the cause, we can better identify how frequently a specific mode of failure will occur.
The occurrence ranking scale, like the severity ranking, is on a relative scale from 1 to 10.
- An occurrence ranking of “10” means the failure mode occurrence is very high; it happens all of the time.
- Conversely, a “1” means the probability of occurrence is remote.
The organization may need to customize the occurrence ranking scale to apply to different levels or complexities of design. It is difficult to use the same scale for a modular design, a complex design, and a custom design. Some organizations develop three different occurrence ranking options (time-based, event-based, and piece-based) and select the option that applies to the design or product.
Step 6: Assign Detection Rankings
To assign detection rankings, consider the design or product-related controls already in place for each failure mode and then assign a detection ranking to each control.
- Think of the detection ranking as an evaluation of the ability of the design controls to prevent or detect the mechanism of failure.
Prevention controls are always preferred over detection controls.
- Prevention controls prevent the cause or mechanism of failure or the failure mode itself from occurring; they generally impact the frequency of occurrence. Prevention controls come in different forms and levels of effectiveness.
- Detection controls detect the cause, the mechanism of failure, or the failure mode itself after the failure has occurred BUT before the product is released from the design stage.
- A detection ranking of “1” means the chance of detecting a failure is almost certain.
- Conversely, a “10” means the detection of a failure or mechanism of failure is absolutely uncertain.
To provide DFMEA teams with meaningful examples of Design Controls, consider adding examples tied to the Detection Ranking scale for design related topics such as:
- Design Rules
- DFA/DFM (design for assembly and design for manufacture)
- Simulation and Verification Testing
Step 7: Calculate the RPN
The RPN is the Risk Priority Number. The RPN gives us a relative risk ranking. The higher the RPN, the higher the potential risk.
The RPN is calculated by multiplying the three rankings together. Multiply the Severity Ranking times the Occurrence Ranking times the Detection Ranking. Calculate the RPN for each failure mode and effect.
Note: The current FMEA Manual from AIAG suggests only calculating the RPN for the highest effect ranking for each failure mode. If this suggestion is followed, there is the risk that it will be too easy to miss the need for further improvement on a specific failure mode.
Since each of the three relative ranking scales ranges from 1 to 10, the RPN will always be between 1 and 1000. The higher the RPN, the higher the relative risk. The RPN gives us an excellent tool to prioritize focused improvement efforts.
Step 8: Develop the Action Plan
Taking action means reducing the RPN. The RPN can be reduced by lowering any of the three rankings (severity, occurrence, or detection) individually or in combination with one another.
- A reduction in the Severity Ranking for a DFMEA is often the most difficult to attain. It usually requires a design change.
- Reduction in the Occurrence Ranking is accomplished by removing or controlling the potential causes or mechanisms of failure.
- And a reduction in the Detection Ranking is accomplished by adding or improving prevention or detection controls.
What is considered an acceptable RPN? The answer to that question depends on the organization.
- For example, an organization may decide any RPN above a maximum target of 200 presents an unacceptable risk and must be reduced. If so, then an action plan identifying who will do what by when is needed.
There are many tools to aid the DFMEA team in reducing the relative risk of those failure modes requiring action. The following recaps some of the most powerful action tools for DFMEAs:
Design of Experiments (DOE)
- A family of powerful statistical improvement techniques that can identify the most critical variables in a design and the optimal settings for those variables.
Mistake-Proofing (Poka Yoke)
- Techniques that can make it impossible for a mistake to occur, reducing the Occurrence ranking to 1. Especially important when the Severity ranking is 10.
Design for Assembly and Design for Manufacture (DFA/DFM)
- Techniques that help simplify assembly and manufacturing by modularizing product sub-assemblies, reducing components, and standardizing components.
Simulations
- Simulation approaches include pre-production prototypes, computer models, accelerated life tests, and value-engineering analyses.
Step 9: Take Action
The Action Plan outlines what steps are needed to implement the solution, who will do them, and when they will be completed.
A simple solution will only need a Simple Action Plan while a complex solution needs more thorough planning and documentation
- Most Action Plans identified during a DFMEA will be of the simple “who, what, & when” category. Responsibilities and target completion dates for specific actions to be taken are identified.
- Sometimes, the Action Plans can trigger a fairly large-scale project. If that happens, conventional project management tools such as PERT Charts and Gantt Charts will be needed to keep the Action Plan on track.
Step 10: Recalculate the Resulting RPN
This step in a DFMEA confirms the action plan had the desired results by calculating the resulting RPN.
To recalculate the RPN, reassess the severity, occurrence and detection rankings for the failure modes after the action plan has been completed.
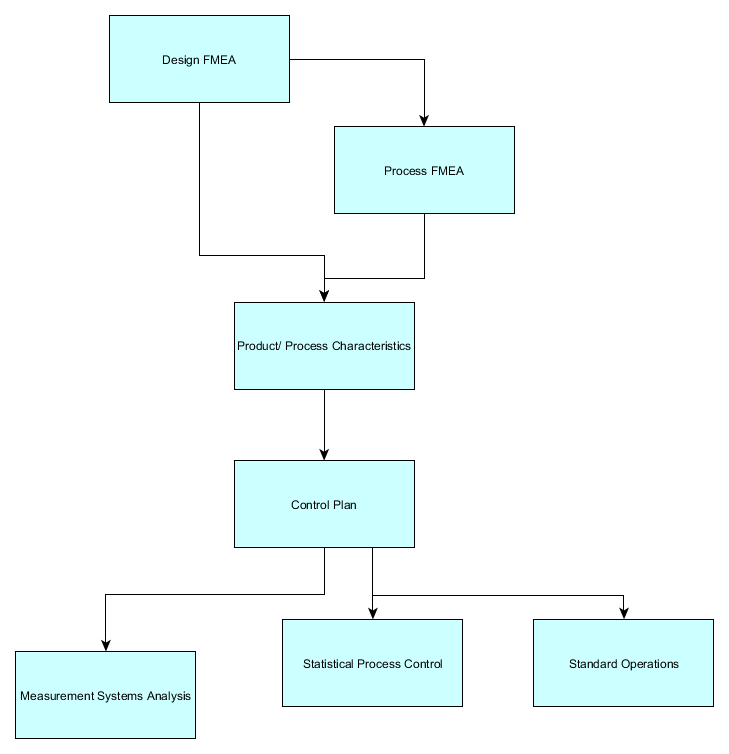
Design for Manufacture
The DFMEA should include any potential failure modes and causes that can occur during the manufacturing or assembly process which are the result of the design. Such failure modes may be mitigated by design changes (e.g. a design feature which prevents a part from being assembled in the wrong orientation i.e. error-proofed). When not mitigated during the DFMEA the aspect or issue should be transferred onto the PFMEA as soon as practicable so as not to forget.
In this respect it is good practise to raise a PFMEA with the DFMEA so when manufacturing issues arise that cannot be mitigated through the design process these should be recorded immediately onto the PFMEA during the DFMEA session.
The DFMEA must take into consideration the physical and technical limits of a manufacturing and assembly process into consideration i.e.:
- Necessary mold drafts
- Limited surface finish capability
- Assembly space (e.g. access for tooling)
- Material qualities and limits
- Tolerances/process capability/performance
The DFMEA should also take into consideration the technical and physical limits of product serviceability and recycling once the product has entered field use, for example:
- Tool access
- Diagnostic capability
- Material classification symbols (for recycling)
- Materials/chemicals used in the manufacturing processes
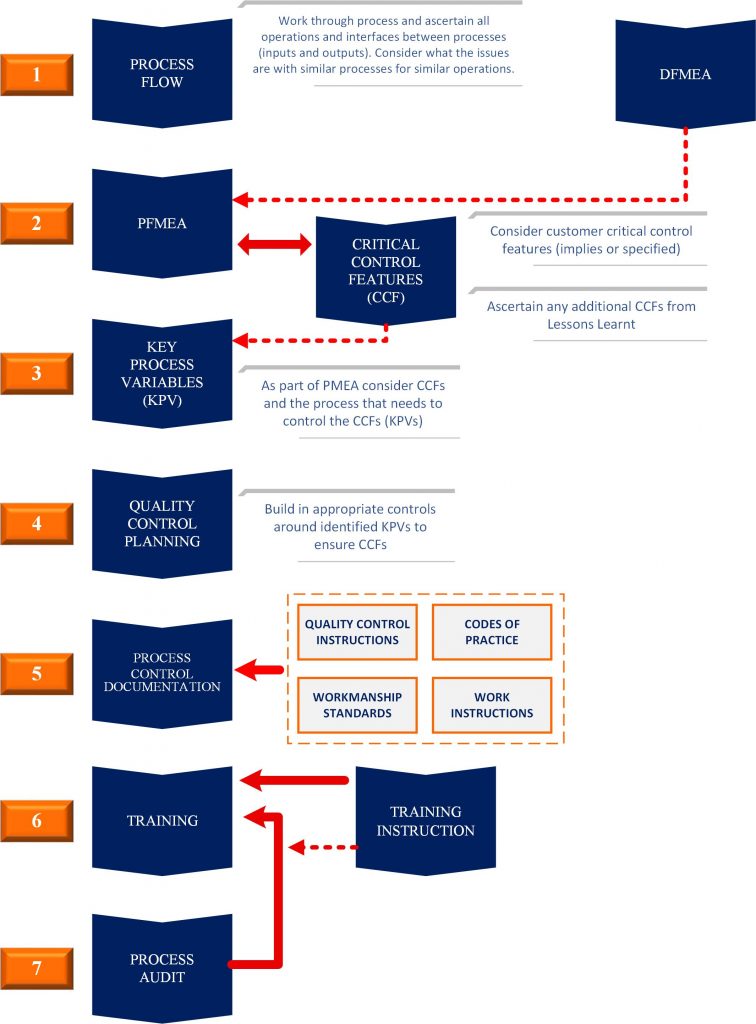
The process flow chart works hand in hand with the control plan and, again is an integral part of the APQP process and IATF 16949. Like the control plan most OEM customers require it as part of their PPAP documentation.
The AIAG APQP reference manual states “The process flow chart is a schematic representation of the current or proposed process flow. It can be used to analyse sources of variations of machines, materials, methods, and manpower from the beginning to end of a manufacturing or assembly process. It is used to emphasise the impact of sources of variation on the process. The flow chart helps to analyse the total process rather than the individual steps in the process. The flow chart assists the organisation’s product quality planning team to focus on the process when conducting the PFMEA and designing the control plan”.
In reality it tends to be generated in conjunction with the control plan. Points to note are:
As it is an integral input document to the control plan, the sequence of operations should be the same in both, as far as is practicable.
The operation reference numbers in both should be the same so that it is easy to see how they work with each other.
The process flow chart will clearly identify any decision points in the process
Step 1 | Review the process
Use a process flowchart to identify each process component.
Review the process components and the intended function or functions of those components.
Use of a detailed flowchart of the process or a traveler (or router) is a good starting point for reviewing the process.
There are several reasons for reviewing the process
First, the review helps assure that all team members are familiar with the process. This is especially important if you have team members who do not work on the process on a daily basis.
The second reason for reviewing the process is to identify each of the main components of the process and determine the function or functions of each of those components.
Finally, this review step will help assure that you are studying all components of the process with the PFMEA.
Using the process flowchart, label each component with a sequential reference number.
These reference numbers will be used throughout the FMEA process.
The marked-up flowchart will give you a powerful visual to refer to throughout the PFMEA.
With the process flowchart in hand, the PFMEA team members should familiarize themselves with the process by physically walking through the process. This is the time to assure everyone on the team understands the basic process flow and the workings of the process components.
For each component, list its intended function or functions.
The function of the component is the value-adding role that component performs or provides.
Many components have more than one function.
Step 2 | Brainstorm potential failure modes
Review existing documentation and data for clues.
Consider the potential failure modes for each component and its corresponding function.
A potential failure mode represents any manner in which the component or process step could fail to perform its intended function or functions.
Using the list of components and related functions generated in Step 1, as a team, brainstorm the potential failure modes for each function.
Don’t take shortcuts here; this is the time to be thorough.
Prepare for the brainstorming session.
Before you begin the brainstorming session, review documentation for clues about potential failure modes.
Step 3 | List potential effects of failure
There may be more than one for each failure.
Determine the effects associated with each failure mode.
The effect is related directly to the ability of that specific component to perform its intended function.
An effect is the impact a failure could make if it occurred.
Some failures will have an effect on the customers and others on the environment, the facility, and even the process itself.
As with failure modes, use descriptive and detailed terms to define effects.
The effect should be stated in terms meaningful to product or system performance.
If the effects are defined in general terms, it will be difficult to identify (and reduce) true potential risks.
Step 4 | Assign Severity rankings
Severity rankings are based on the severity of the consequences of failure.
Assign a severity ranking to each effect that has been identified.
The severity ranking is an estimate of how serious an effect would be should it occur.
To determine the severity, consider the impact the effect would have on the customer, on downstream operations, or on the employees operating the process.
The severity ranking is based on a relative scale ranging from 1 to 10.
A “10” means the effect has a dangerously high severity leading to a hazard without warning.
Conversely, a severity ranking of “1” means the severity is extremely low.
Step 5 | Assign Occurrence rankings
Occurrence rankings are based on how frequently the cause of the failure is likely to occur.
Next, consider the potential cause or failure mechanism for each failure mode; then assign an occurrence ranking to each of those causes or failure mechanisms.
We need to know the potential cause to determine the occurrence ranking because, just like the severity ranking is driven by the effect, the occurrence ranking is a function of the cause. The occurrence ranking is based on the likelihood, or frequency, that the cause (or mechanism of failure) will occur.
If we know the cause, we can better identify how frequently a specific mode of failure will occur. How do you find the root cause?
There are many problem-finding and problem-solving methodologies.
One of the easiest to use is the 5-Whys technique.
Once the cause is known, capture data on the frequency of causes. Sources of data may be scrap and rework reports, customer complaints, and equipment maintenance records.
The occurrence ranking scale, like the severity ranking, is on a relative scale from 1 to 10.
An occurrence ranking of “10” means the failure mode occurrence is very high, and happens all of the time. Conversely, a “1” means the probability of occurrence is remote.
See FMEA Checklists and Forms for an example PFMEA Occurrence Ranking Scale.
Your organization may need an occurrence ranking scale customized for a low-volume, complex assembly process or a mixture of high-volume, simple processes and low-volume, complex processes.
Consider customized occurrence ranking scales based on time-based, event-based, or piece-based frequencies.
See FMEA Checklists and Forms for examples of Custom PFMEA Ranking Scales. (Examples of custom scales for severity, occurrence, and detection rankings are included in this Resource Center.)
Step 6 | Assign Detection rankings
Based on the chances the failure will be detected prior to the customer finding it.
To assign detection rankings, identify the process or product related controls in place for each failure mode and then assign a detection ranking to each control. Detection rankings evaluate the current process controls in place.
A control can relate to the failure mode itself, the cause (or mechanism) of failure, or the effects of a failure mode.
To make evaluating controls even more complex, controls can either prevent a failure mode or cause from occurring or detect a failure mode, cause of failure, or effect of failure after it has occurred.
Note that prevention controls cannot relate to an effect. If failures are prevented, an effect (of failure) cannot exist!
The Detection ranking scale, like the Severity and Occurrence scales, is on a relative scale from 1 to 10.
A Detection ranking of “1” means the chance of detecting a failure is certain.
Conversely, a “10” means there is absolute certainty of non-detection. This basically means that there are no controls in place to prevent or detect.
See FMEA Checklists and Forms for an example PFMEA Detection Ranking Scale.
Taking a lead from AIAG, consider three different forms of Custom Detection Ranking options. Custom examples for Mistake-Proofing, Gauging, and Manual Inspection controls can be helpful to PFMEA teams.
See FMEA Checklists and Forms for examples of Custom PFMEA Ranking Scales. (Examples of custom scales for severity, occurrence, and detection rankings are included in this Resource Center.)
Step 7 | Calculate the RPN
RPN = Severity X Occurrence X Detection.
The RPN is the Risk Priority Number. The RPN gives us a relative risk ranking. The higher the RPN, the higher the potential risk.
The RPN is calculated by multiplying the three rankings together. Multiply the Severity ranking times the Occurrence ranking times the Detection ranking. Calculate the RPN for each failure mode and effect.
Editorial Note: The current FMEA Manual from AIAG suggests only calculating the RPN for the highest effect ranking for each failure mode. We do not agree with this suggestion; we believe that if this suggestion is followed, it will be too easy to miss the need for further improvement on a specific failure mode.
Since each of the three relative ranking scales ranges from 1 to 10, the RPN will always be between 1 and 1000. The higher the RPN, the higher the relative risk. The RPN gives us an excellent tool to prioritize focused improvement efforts.
Step 8 | Develop the action plan
Define who will do what by when.
Taking action means reducing the RPN.
The RPN can be reduced by lowering any of the three rankings (severity, occurrence, or detection) individually or in combination with one another.
A reduction in the Severity ranking for a PFMEA is often the most difficult. It usually requires a physical modification to the process equipment or layout.
Reduction in the Occurrence ranking is accomplished by removing or controlling the potential causes.
Mistake-proofing tools are often used to reduce the frequency of occurrence.
A reduction in the Detection ranking can be accomplished by improving the process controls in place.
Adding process fail-safe shut-downs, alarm signals (sensors or SPC), and validation practices including work instructions, set-up procedures, calibration programs, and preventative maintenance are all detection ranking improvement approaches.
What is considered an acceptable RPN? The answer to that question depends on the organization.
For example, an organization may decide any RPN above a maximum target of 200 presents an unacceptable risk and must be reduced. If so, then an action plan identifying who will do what by when is needed.
There are many tools to aid the PFMEA team in reducing the relative risk of failure modes requiring action.
Among the most powerful tools are Mistake-Proofing, Statistical Process Control, and Design of Experiments.
Mistake-Proofing (Poka Yoke)
Techniques that can make it impossible for a mistake to occur, reducing the Occurrence ranking to 1.
Especially important when the Severity ranking is 10.
STATISTICAL PROCESS CONTROL (SPC)
A statistical tool that helps define the output of a process to determine the capability of the process against the specification and then to maintain control of the process in the future.
DESIGN OF EXPERIMENTS (DOE)
A family of powerful statistical improvement techniques that can identify the most critical variables in a process and the optimal settings for these variables.
Step 9 | Take action
Implement the improvements identified by your PFMEA team.
The Action Plan outlines what steps are needed to implement the solution, who will do them, and when they will be completed.
A simple solution will only need a Simple Action Plan while a complex solution needs more thorough planning and documentation.
Most Action Plans identified during a PFMEA will be of the simple “who, what, & when” category. Responsibilities and target completion dates for specific actions to be taken are identified.
Sometimes, the Action Plans can trigger a fairly large-scale project. If that happens, conventional project management tools such as PERT Charts and Gantt Charts will be needed to keep the Action Plan on track.
Most Action Plans identified during a PFMEA will be of the simple “who, what, & when” category. Responsibilities and target completion dates for specific actions to be taken are identified.
Step 10 | Calculate the resulting RPN
Re-evaluate each of the potential failures once improvements have been made and determine the impact of the improvements.
This step in a PFMEA confirms the action plan had the desired results by calculating the resulting RPN.
To recalculate the RPN, reassess the severity, occurrence, and detection rankings for the failure modes after the action plan has been completed.
Control plans are essential requirements of the APQP process and are also a requirement of IATF 16949. Most OEM customers require controls plans to be submitted as part of their PPAP package.
The AIAG APQP reference manual states “A control plan is a written description of the system for controlling parts and processes”.
IATF 16949 states:
A control plan shall;
- List the controls used for the manufacturing process,
- Include methods for monitoring of control exercised over special characteristics defined by both the customer and organisation,
- Include the customer required information, if any, and,
- Initiate the specified reaction plan when the process becomes unstable or not statistically capable.
We tend to treat the control plan as a document required to keep the customer happy but it has more important internal purposes e.g.
- It is an important part of our quality planning process. It helps us to define the process that shall be followed.
- It allows us to ensure that that the processes are adequately defined and documented.
- It helps us ensure that the process is in a logical sequence.
- It allows us to confirm that we have the correct checks and tests in place and we are setting the correct sample levels.
- We can verify that we have the relevant production and test tooling.
As such, it shall be used as a working document that defines the processes to be followed and shall be adhered to by all involved in the process. Once approved by the customer the processes are considered to be locked down and can’t be deviated from without re-approval.
Control plans are developed in conjunction with the process flow and the design control documents including FMEAs.
My control plan format is based on the AIAG suggested format.
An extract from a control plan is attached. This has been marked up to identify the key elements.
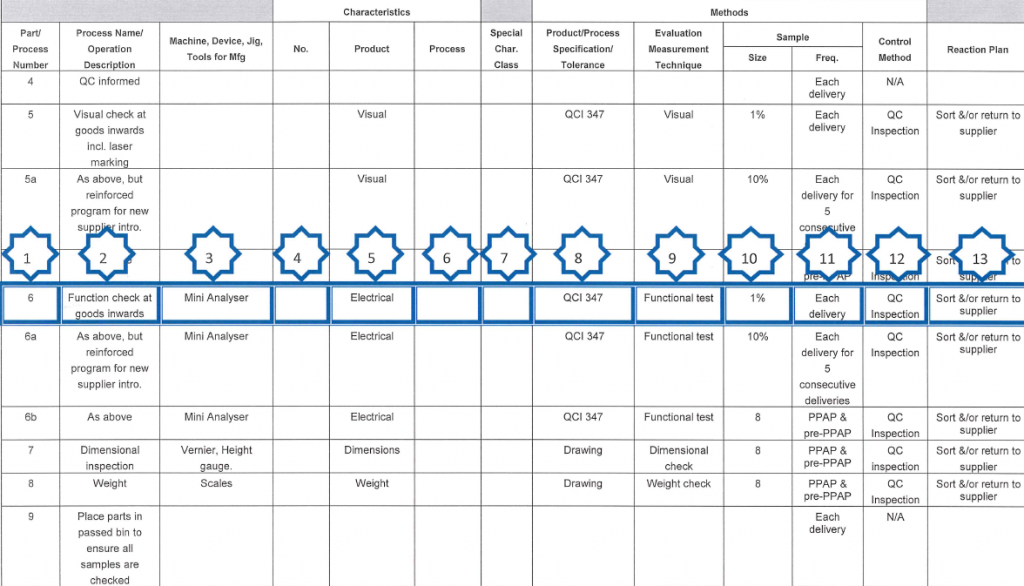
- This is just a sequential number but should follow the numbers and sequence defined on the process flow.
- This is a description of the operation and, again, should align with the process flow.
- This defines any tools, jigs, fixtures or equipment that is necessary to carry out the specific operation.
- This is used to cross reference any specific references on documents e.g. a specific item on a drawing.
- This defines the product characteristic that we are checking. Product characteristics are features or properties of a part, component or assembly that are described on drawings or other engineering documents.
- This defines the process characteristic that we are checking. Process characteristics are the process variables (input variables) that have a cause and effect relationship with the identified product characteristic. A process characteristic can only be measured at the time at it occurs. An example would be the voltage applied during test. We do not typically use process characteristics and it is normal to have either a product or process characteristic but not both.
- If special characteristics are defined, either by the customer or design department, insert the appropriate symbol here. This will be the same symbol that appears on the drawing or instruction. If there are any special characteristics stated some appropriate measurement or check must be included in the control plan to verify that characteristic.
- This column is used to specify the tolerance or reference the document that specifies the tolerance and/or defines the process.
- Use this column to specify the measurement or evaluation system being used, in broad terms.
- This states the sample size that must be used.
- This defines the frequency of checking.
- This is intended to be a brief description of how the process is controlled. Strictly this should define the relevant procedure number but we tend to include that in (8).
- The reaction plan specifies the corrective action necessary to avoid producing nonconforming products or operating out of control. Ours tend to be very simplistic but this could be more detailed like re-setting the machine.
Characteristic
The growing importance of measurements conducted in the organization, the results of which are growing
more often they can be used to control production processes, slowing down
finished products from production or deciding on the acceptance of raw materials dictates
pay attention to the measuring systems that generate them. As a measuring system in MSA
the system of three components is treated, which together decide on its properties
and possible application:
1) measurement method,
2) equipment and software used for measurement,
3) personnel performing measurements.
Measurement systems should ensure that the data being the measurement results
they have appropriate statistical properties, i.e. they are of adequate quality. properties
these are most often a systematic error regarding the location of data relative to
reference value and variance in data dispersion.
The analysis of measuring systems is to ensure that the results of the measurements
they can be applied to the procedures adopted by the organization for their use.
Knowing that few measurement systems generate zero results
variance and zero statistical error, organization through evaluation used
measurement systems want to know their imperfection.
The measurement system analysis consists of two phases.
The first phase consists in verifying whether the measurement is carried out on the correct one
variable and whether it has appropriate statistical properties for its use
enabling the intended use in the organization. This phase should be carried out
before actual use of the system in the organization. An additional task
is to determine if the system may require certain conditions to be ensured
the regularity of his work. If environmental conditions exist, such as for example
temperature, humidity or lighting that can have a significant impact
on the quality of measurements, the organization should monitor and supervise these values to
ensure that this impact is minimized.
The purpose of the second phase of the measurement system analysis is to verify that the measurement system
after accepting it for use in the organization will keep it suitable for
him statistical properties. The second phase is often treated as a general element
measurement management system, also covering issues such as supervision
over the equipment used for measurements or ensuring measurement consistency.
The quality of the measurement system is usually determined solely by means of statistics
data properties it produces. Other properties such as ergonomics
applications, cost or time necessary to perform the measurement are significant for the organization,
but they do not determine the quality of the system. Basic determined properties
in the second phase of measurement systems assessment are: systematic error (in some iterature sources also called accuracy), stability, linearity, repeatability
and reproducibility. The second phase of MSA is often called repeatability assessment
and instrument reproducibility (Gage Repeatability and Reproducibility – Gage R&R), because
these parameters are most often determined as part of the evaluation of measuring systems.
Precision:
Closeness of epeated readings to each other
random error component of the measurement system
Where does MSA Fit?